Investor Relations

 Submenu
Why Invest in RMKE?
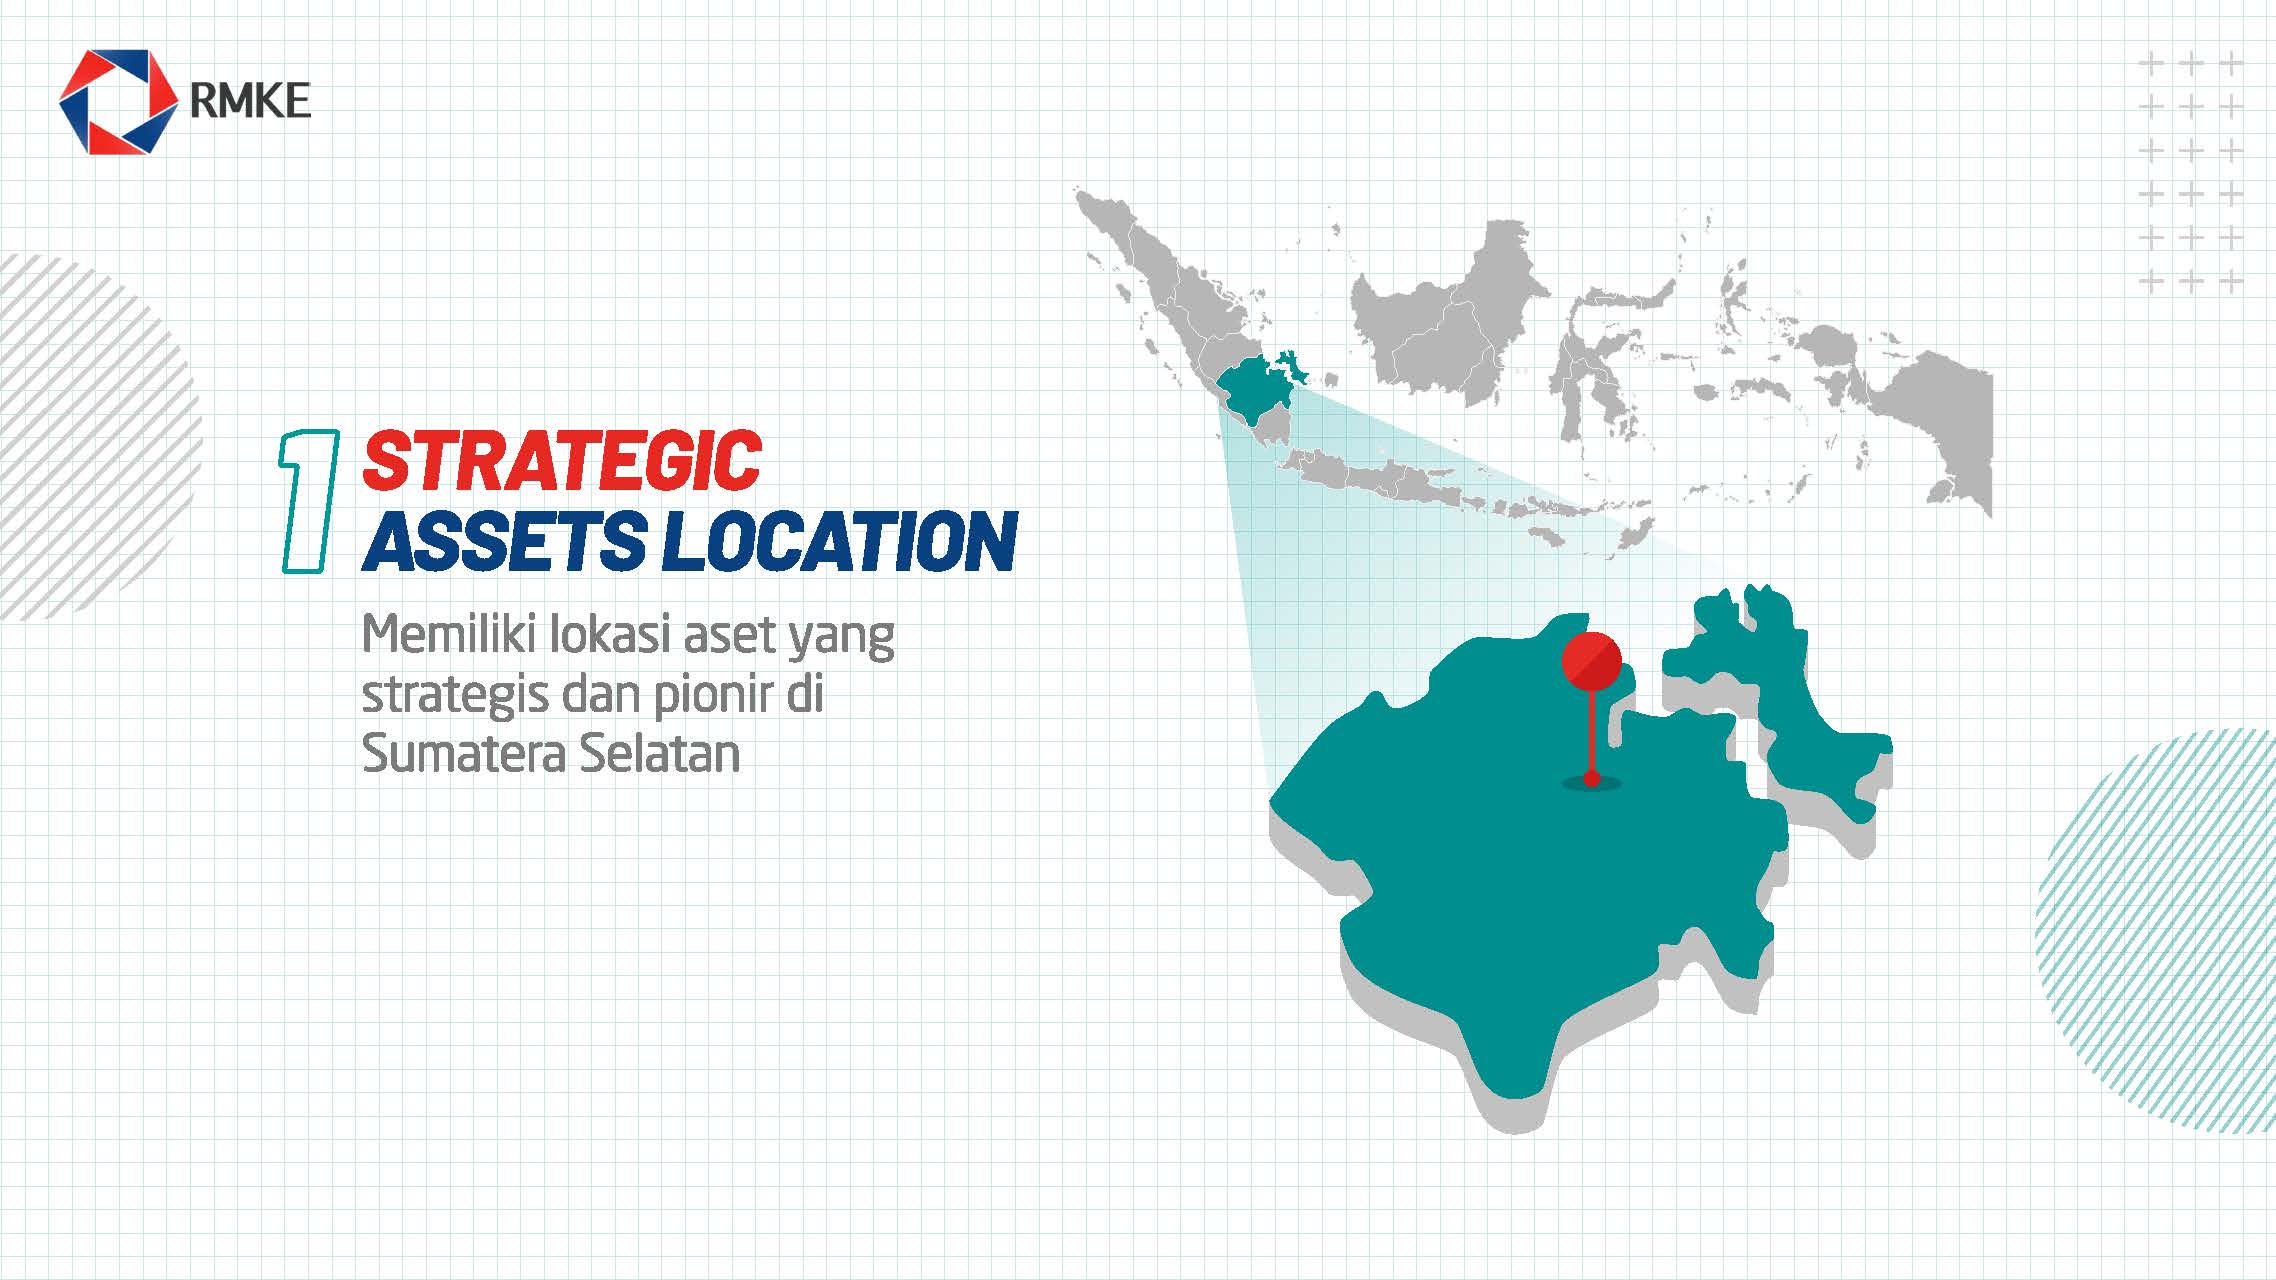
Located in a strategic area and the pioneer in South Sumatera.
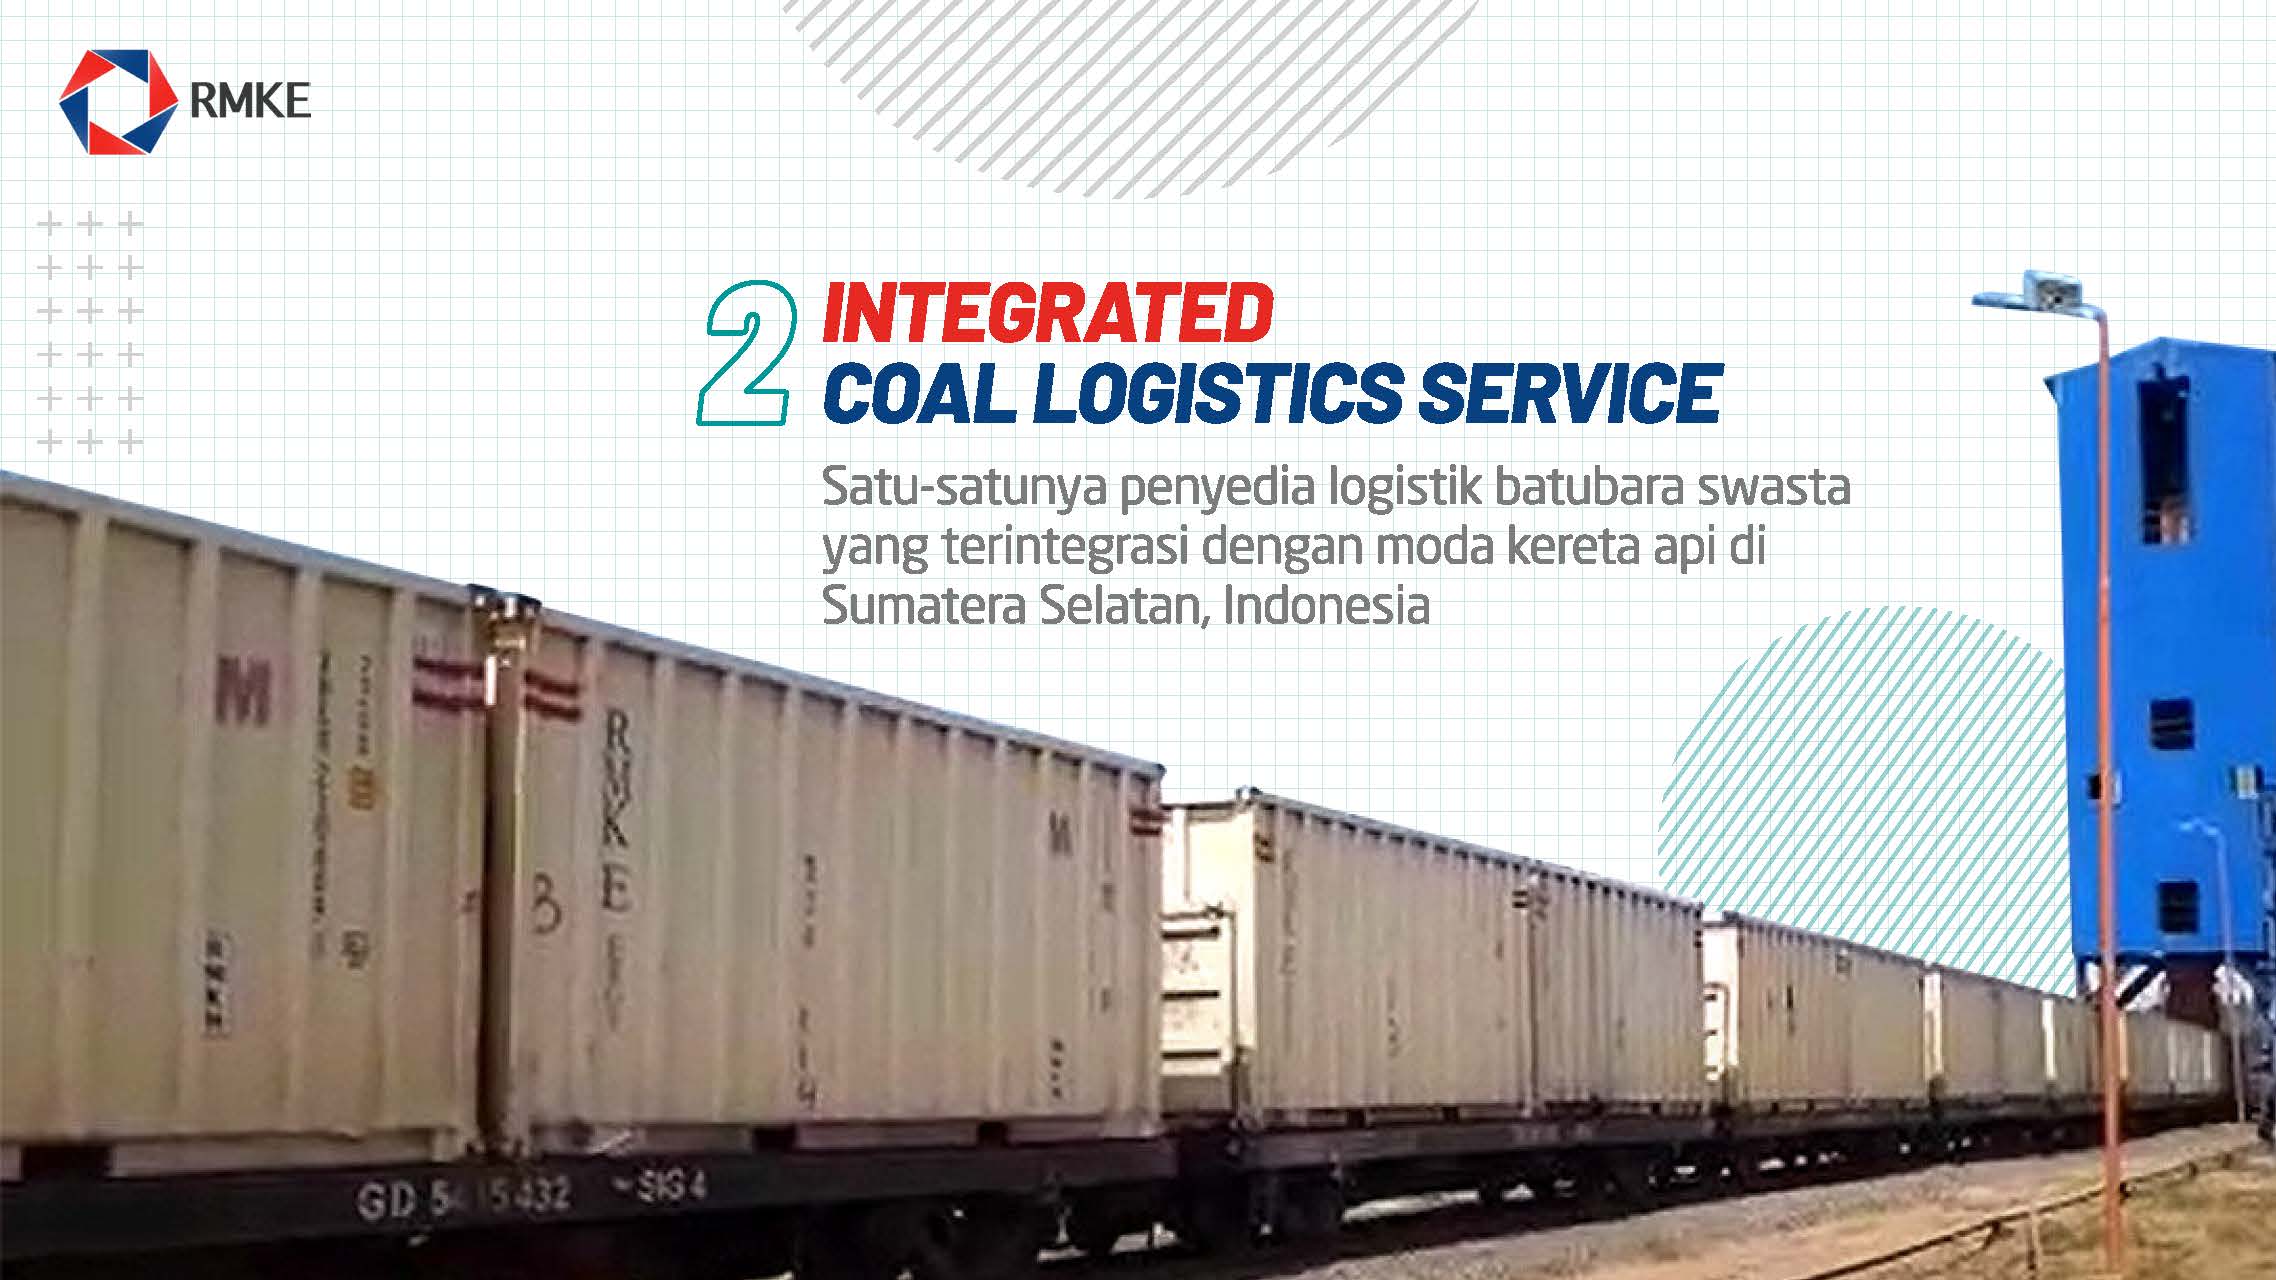
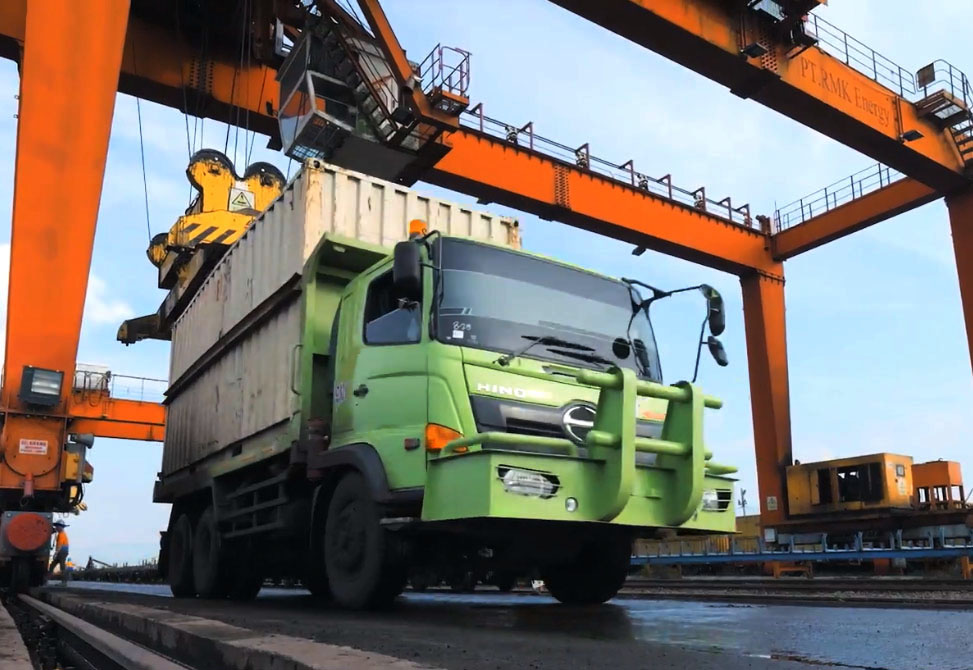
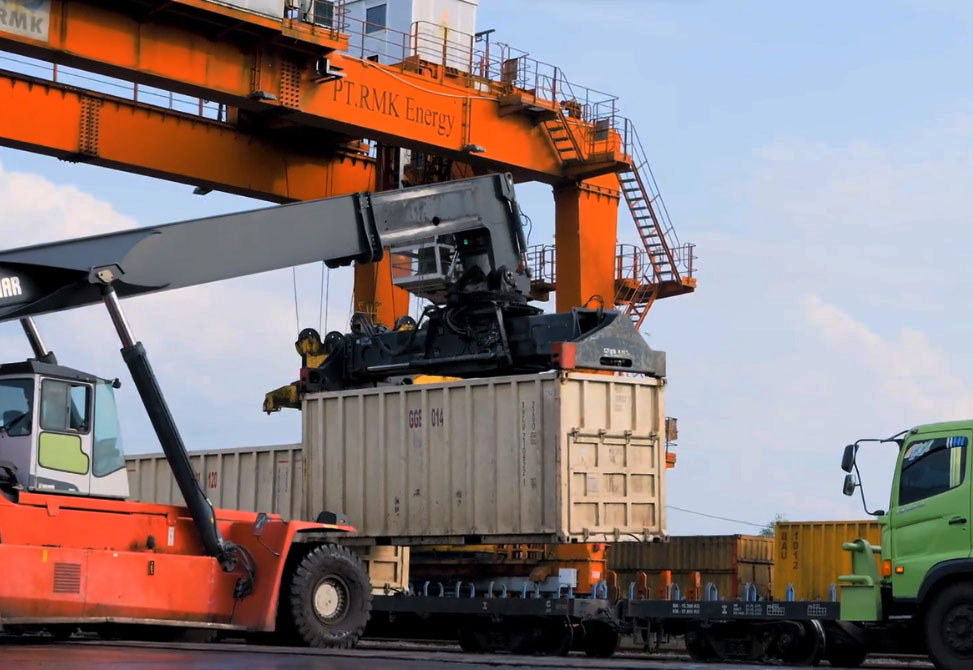
The only private coal logistic providers integrated with train in South Sumatra Province, Indonesia.
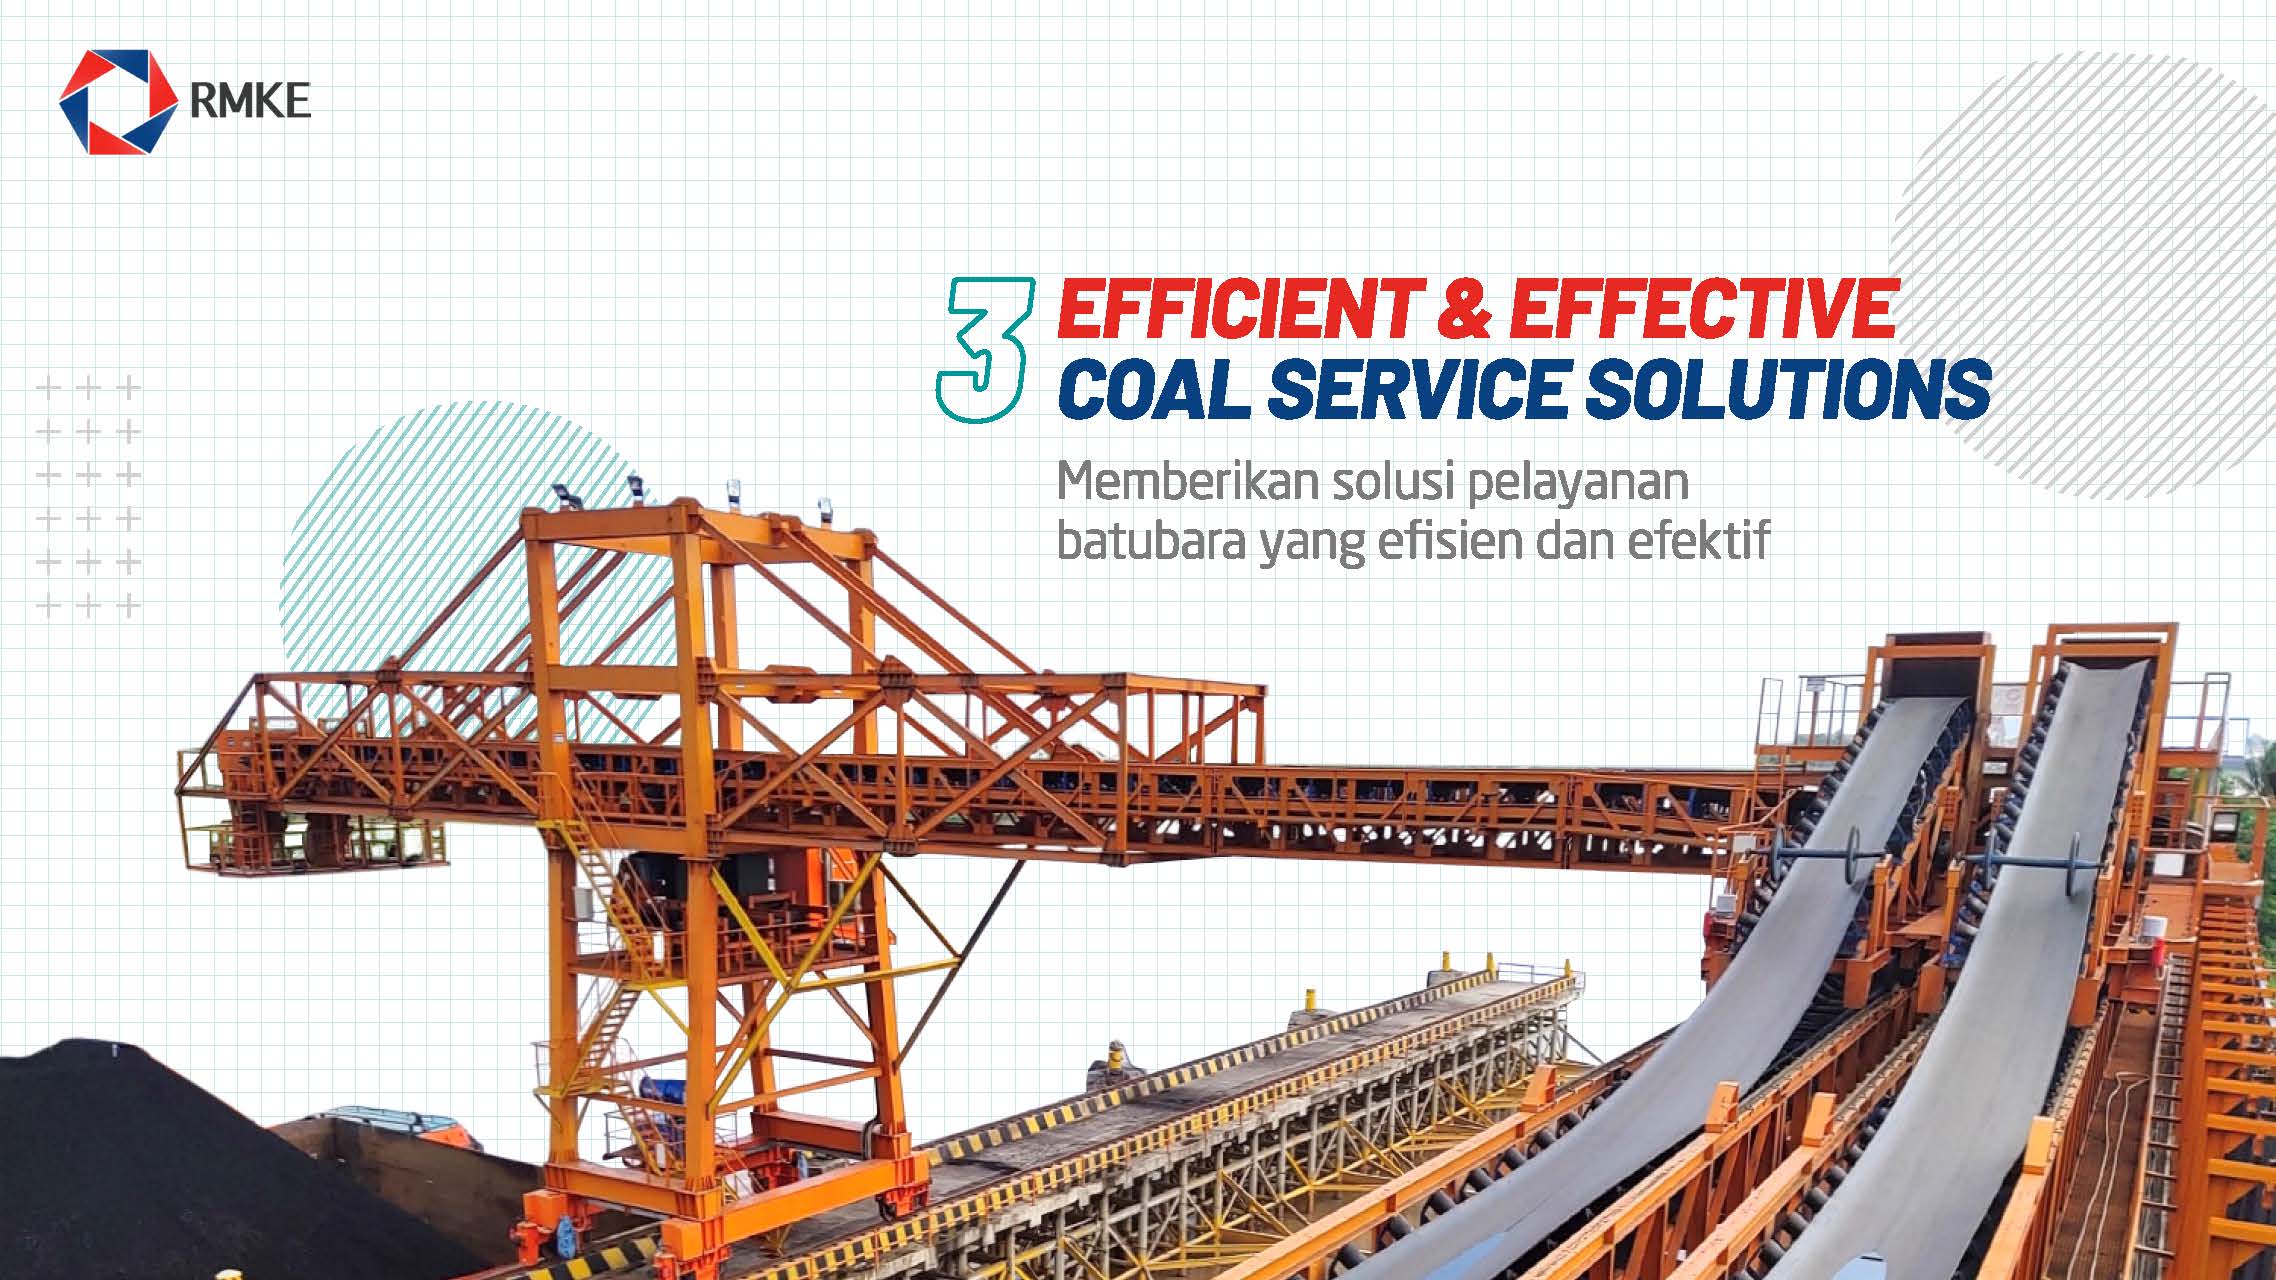
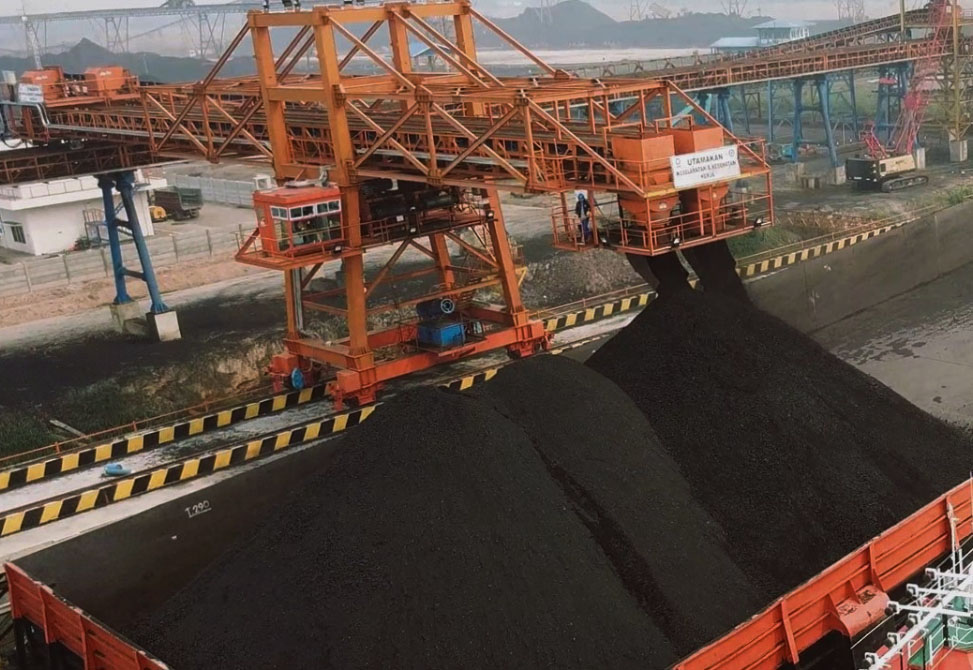
Providing efficient and effective coal service solutions.
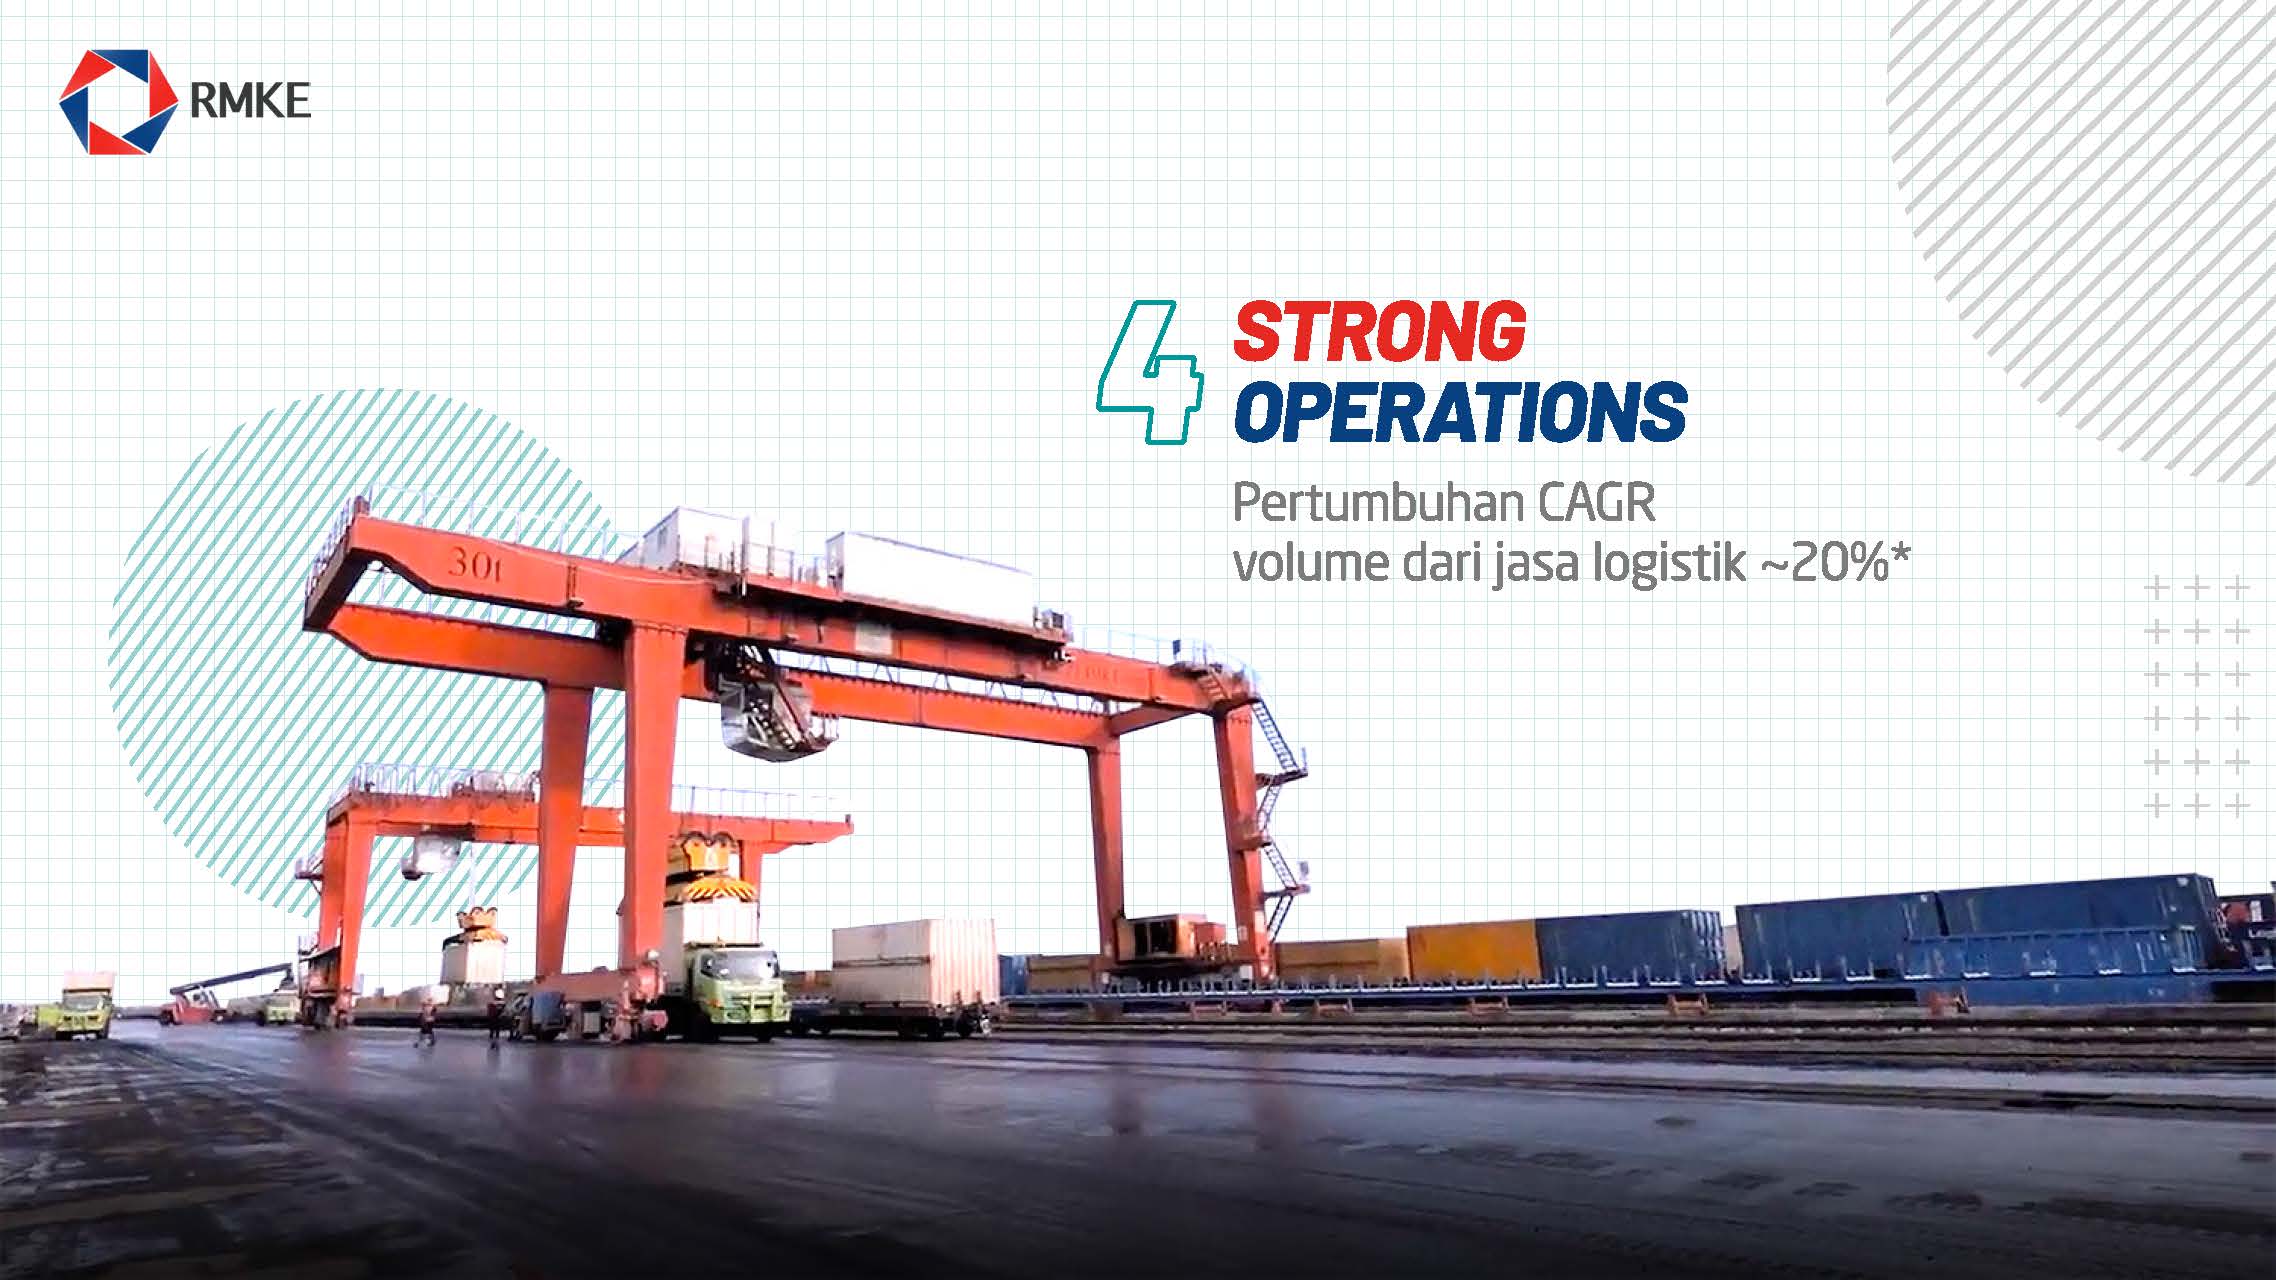
~20% CAGR from service logistic volume*
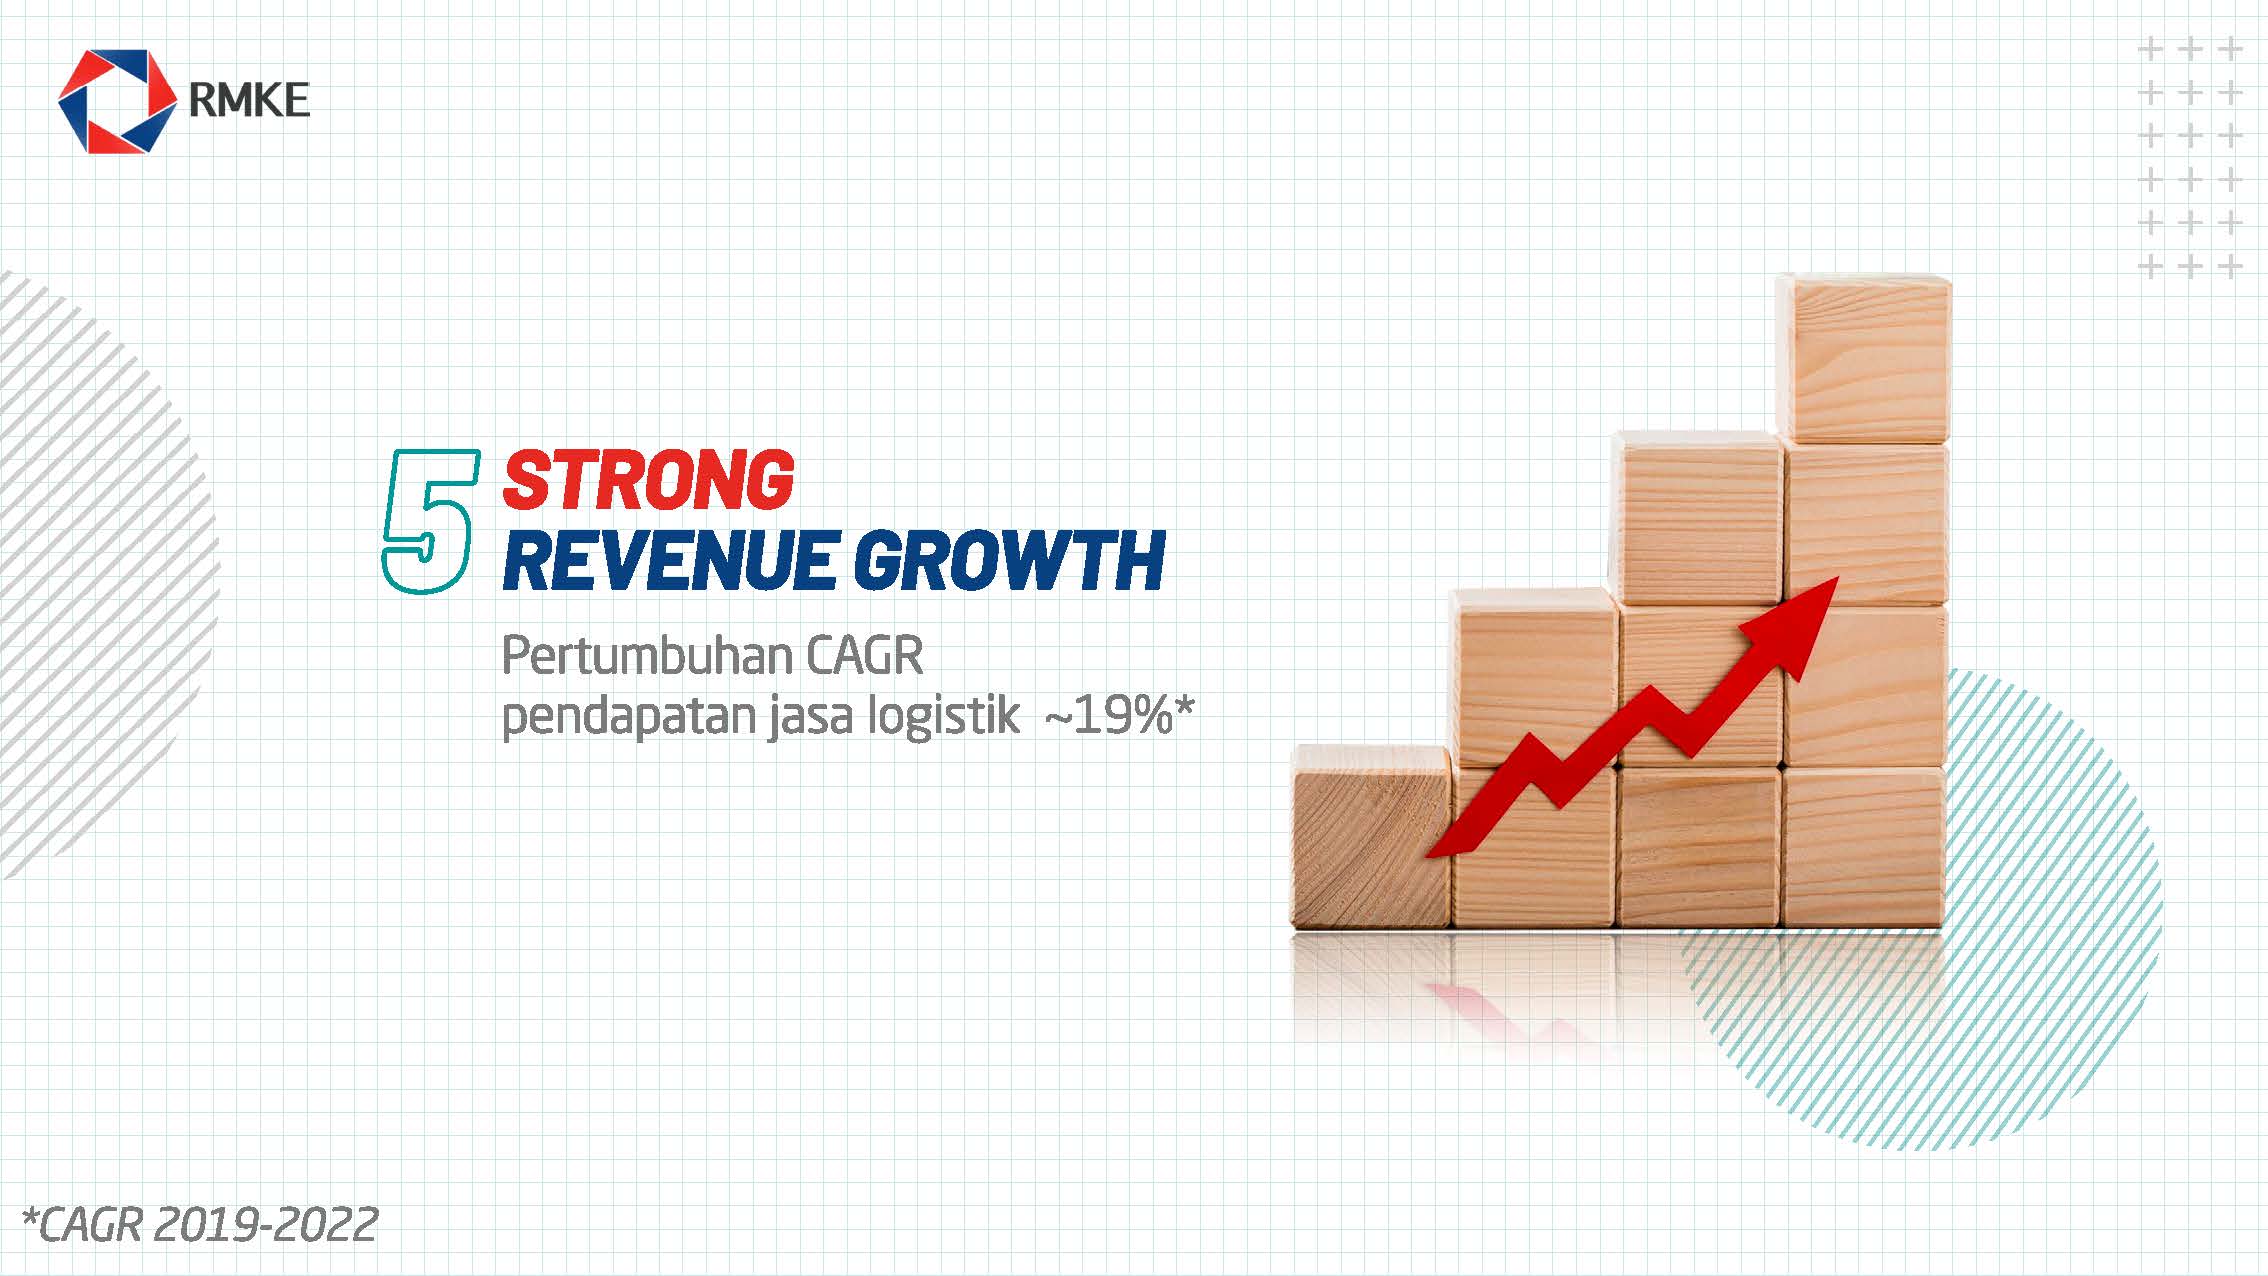
~19% CAGR from service logistic volume*
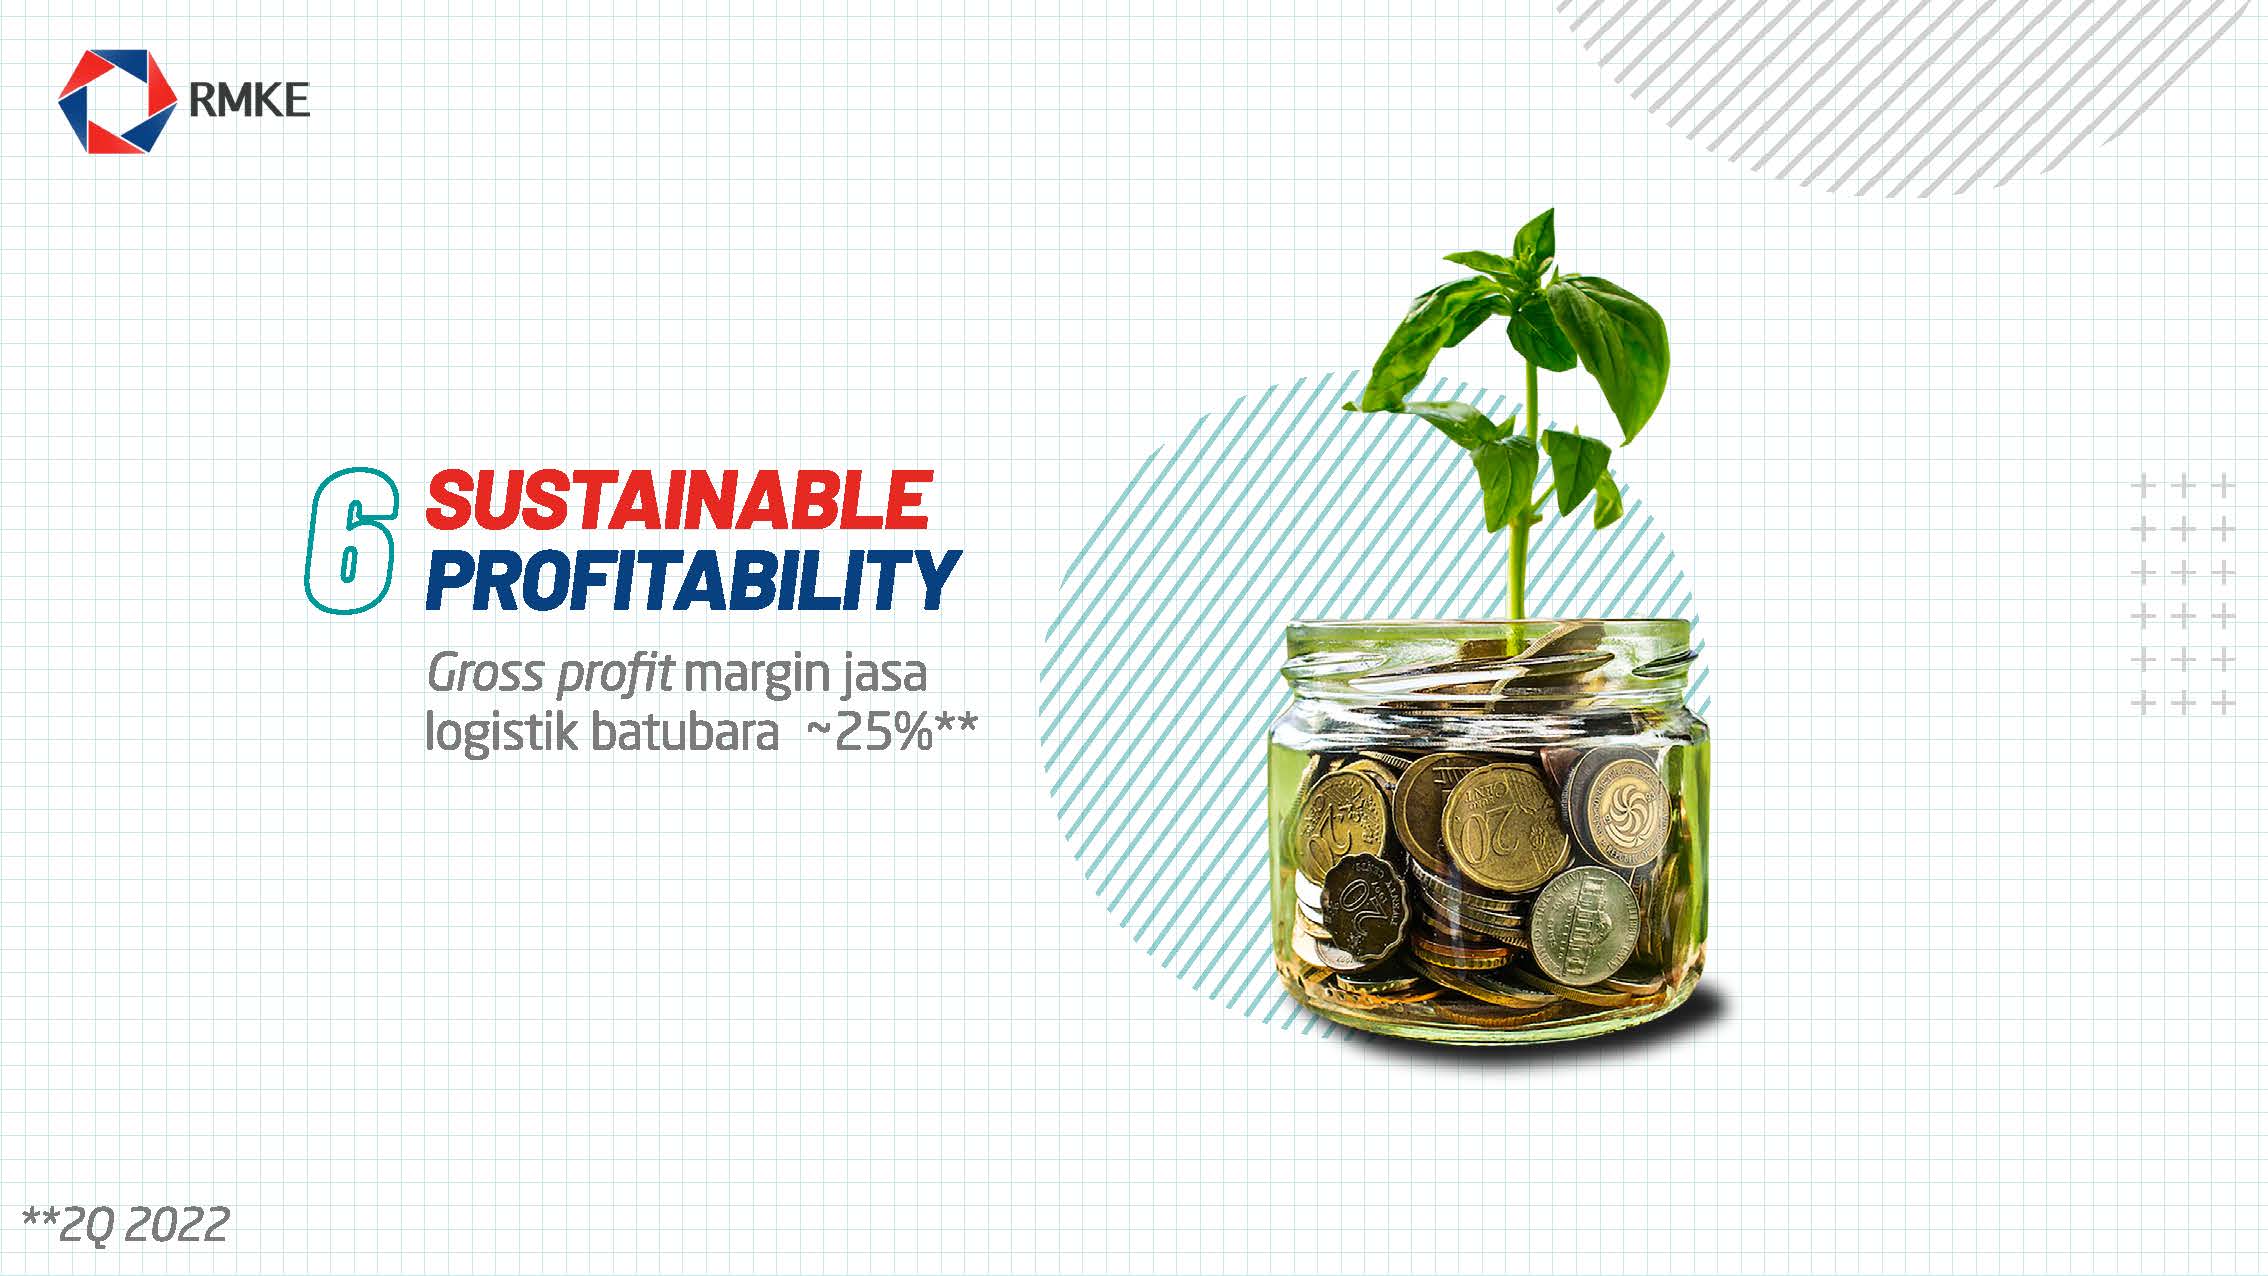
Gross profit margin ̴25% from service logistic**
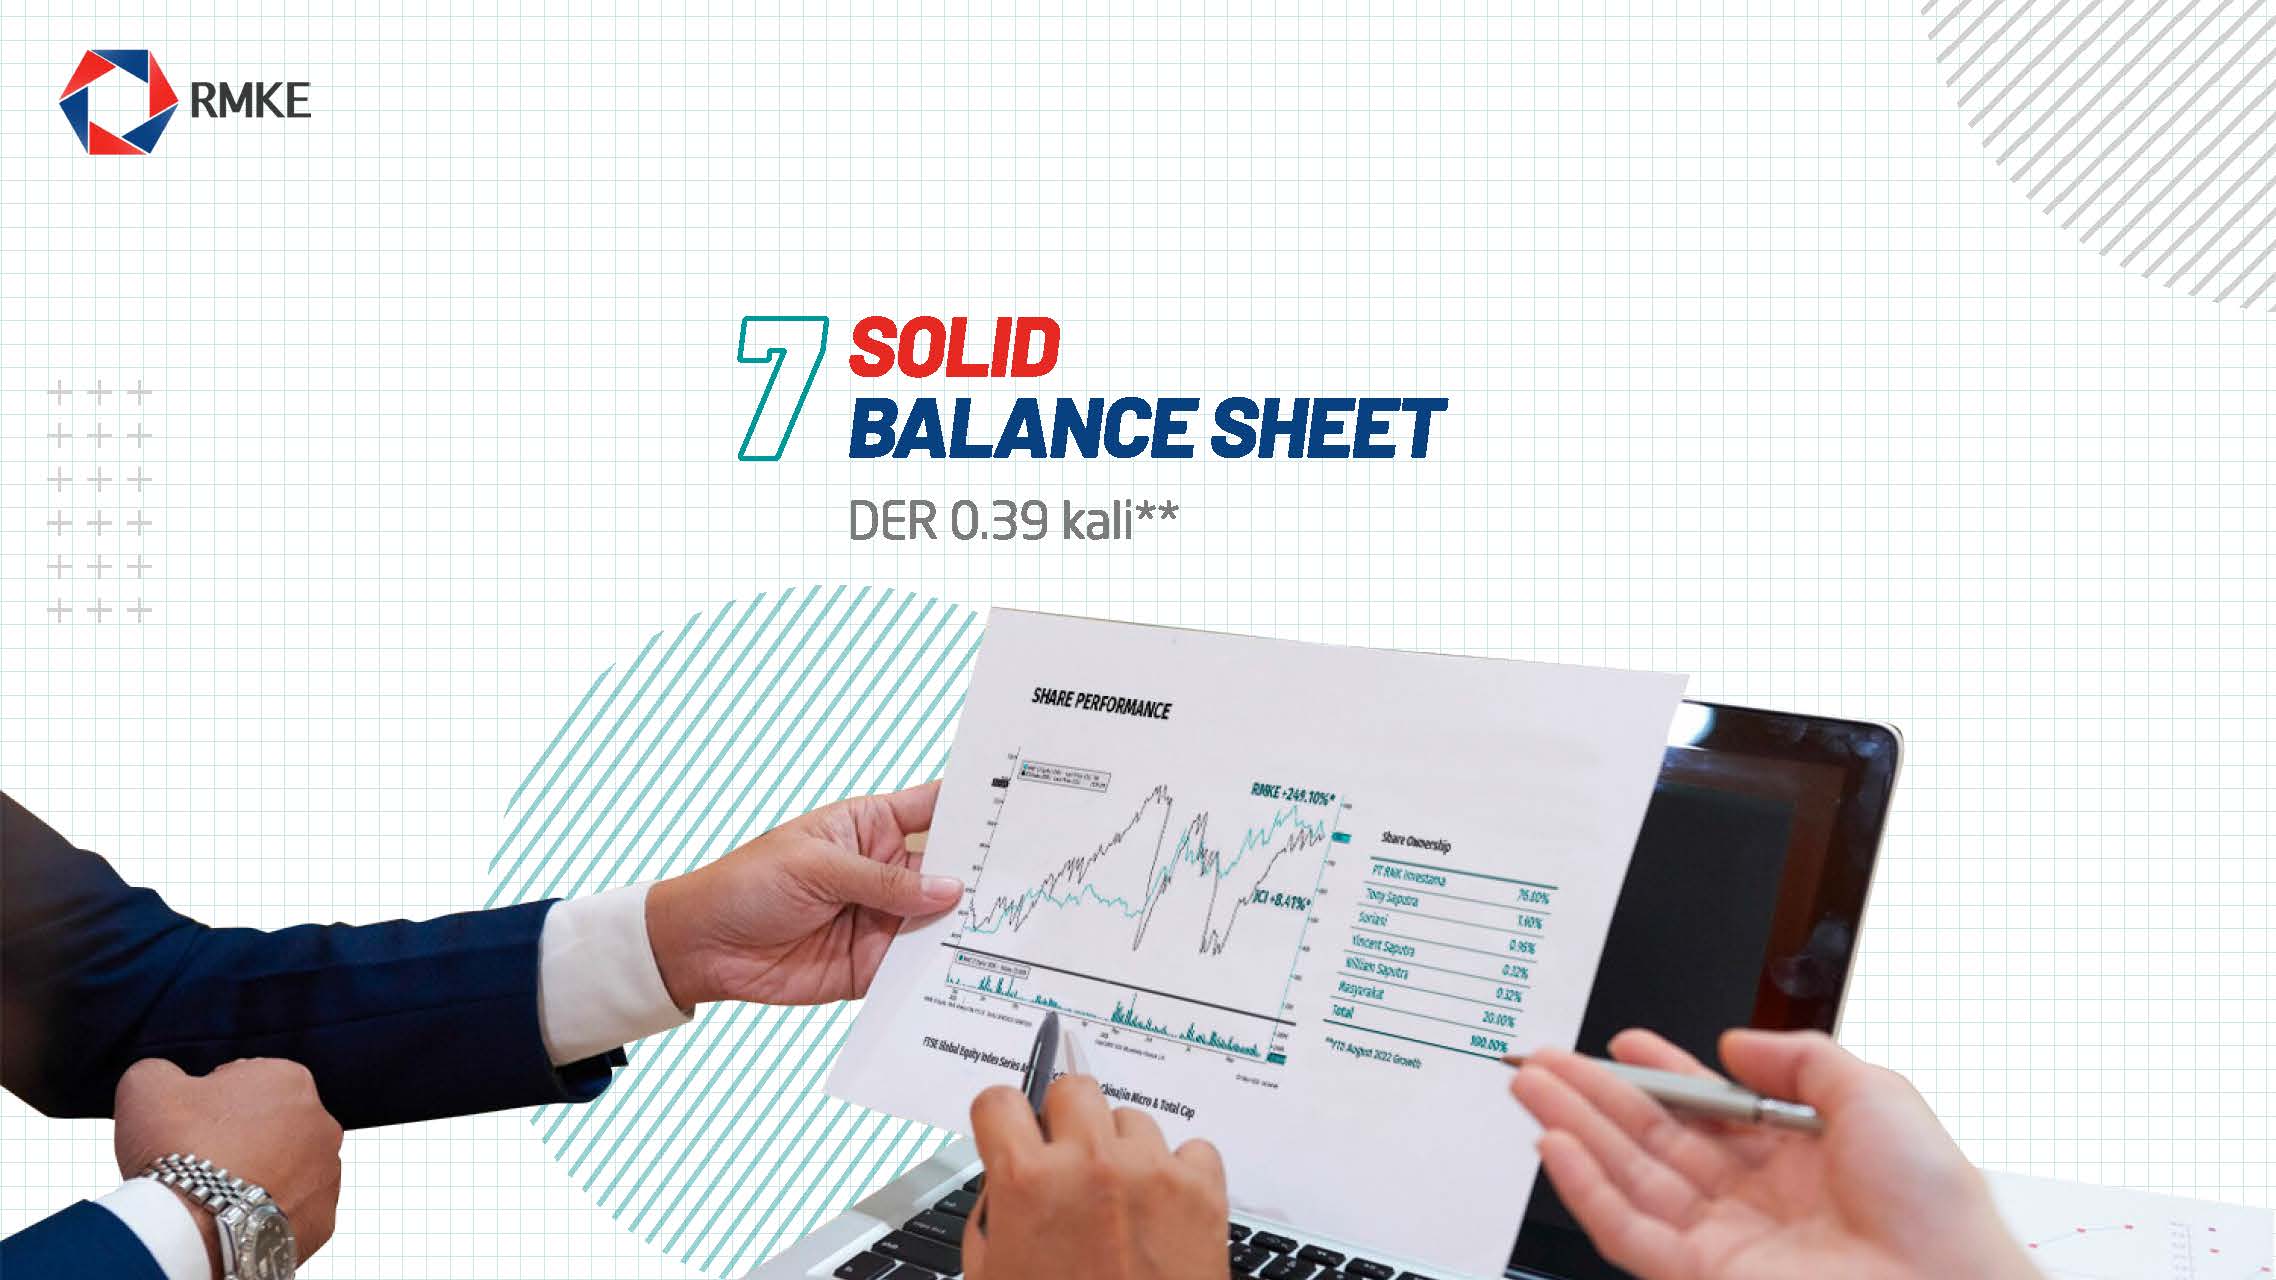
DER 0.39 time**
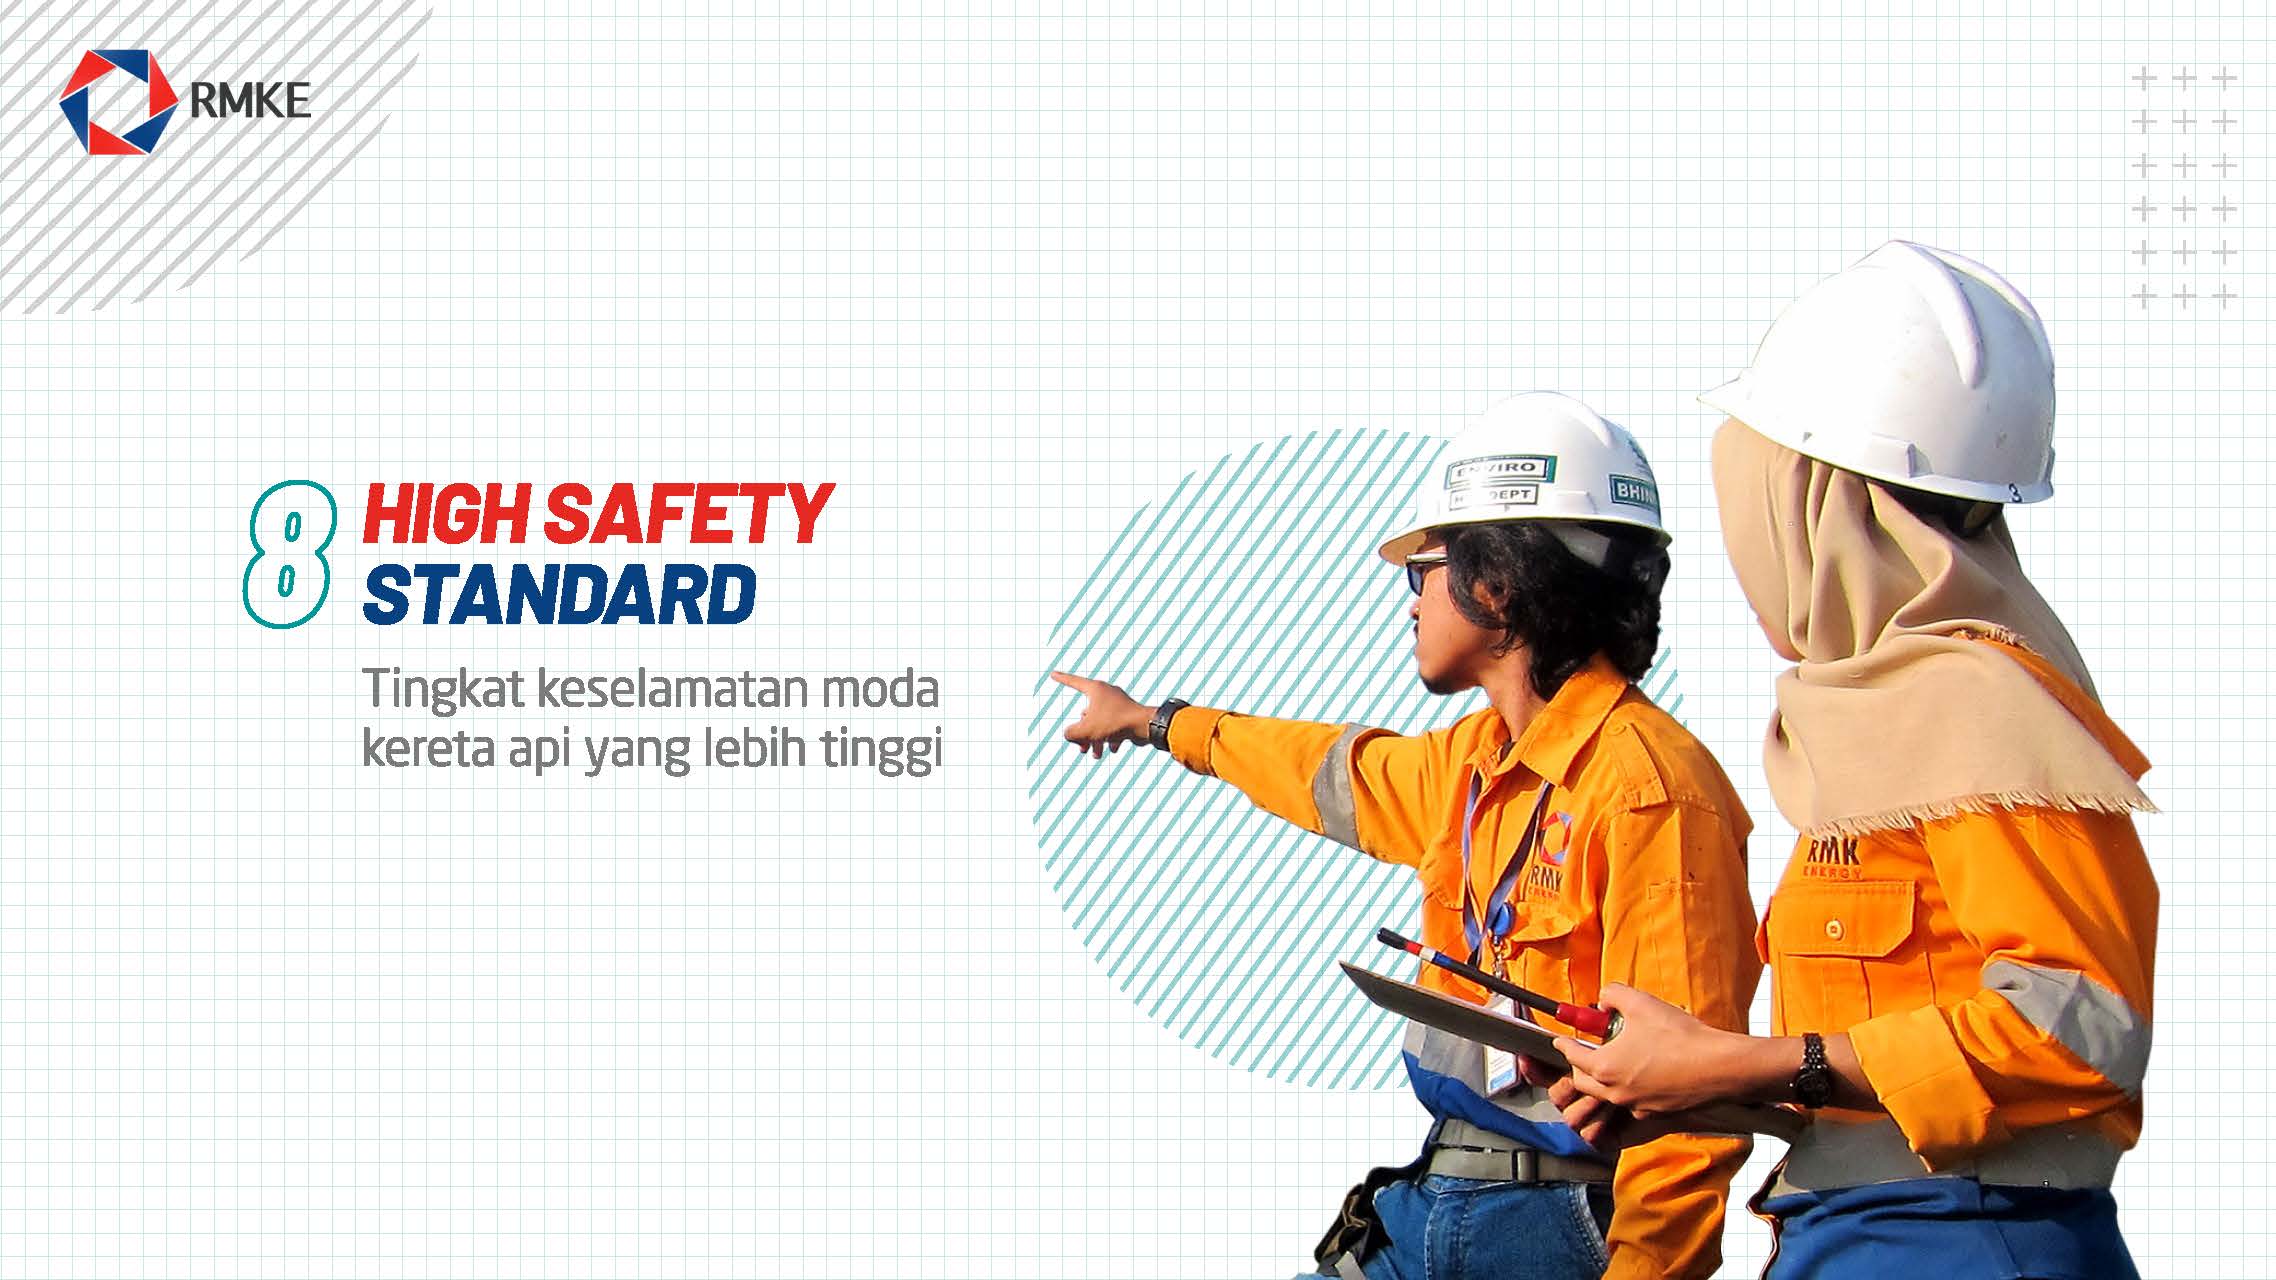
Railway is the safest mode of land transportation.
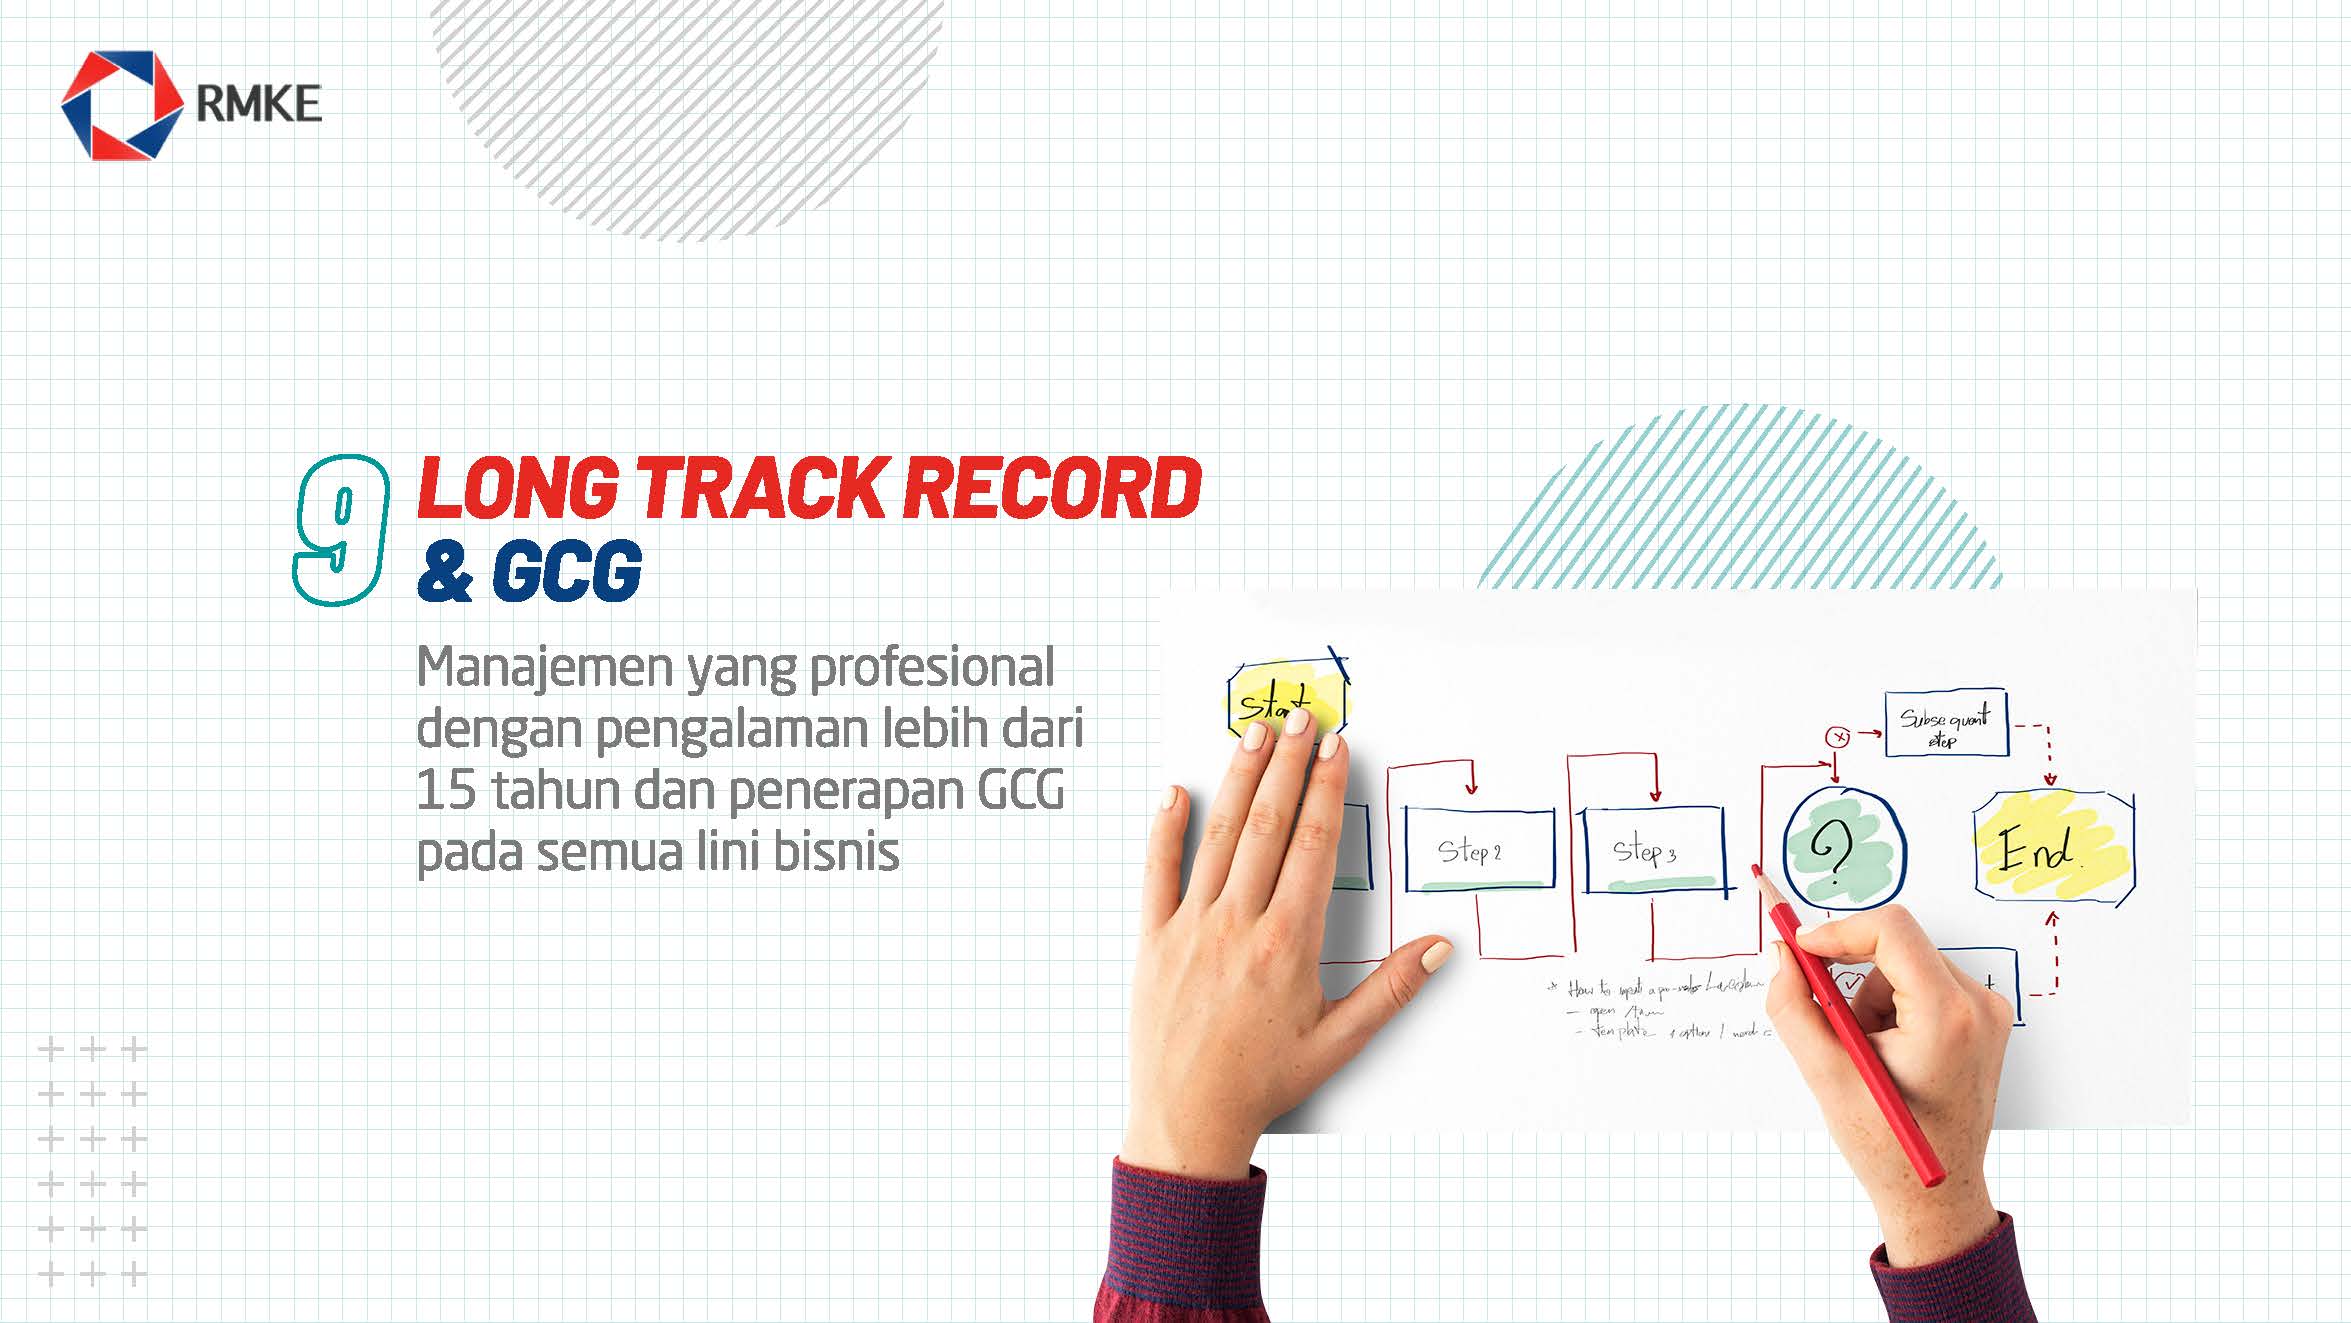
Professional and experienced management team and implementation of GCG in all business lines.
* CAGR 2019-2021
** Base on June 2022 Performance
** Base on June 2022 Performance